More new customers who come back. On a smaller budget.

  • Google Ads
  • 20 July to 1 October 2026
Customer
Espresso International
Sector
Italian coffee, accessories, delicatessen
Seat
Hamburg, online shop and warehouse sales
Shop
Shopify, relaunch January 2026
Channels
Google Ads, Shopping via CSS, Meta
Project
Customer Value Analysis and Conversion of the Google Ads Account, live since 20.07.2026
  • −21.5 %

    Costs per new customer

  • +24.0 %

    New customers with 2.6% less advertising budget

  • +55.9 %

    New customer revenue per advertising euro

  • +21.5 %

    Ø Shopping cart in the first purchase

About the fire

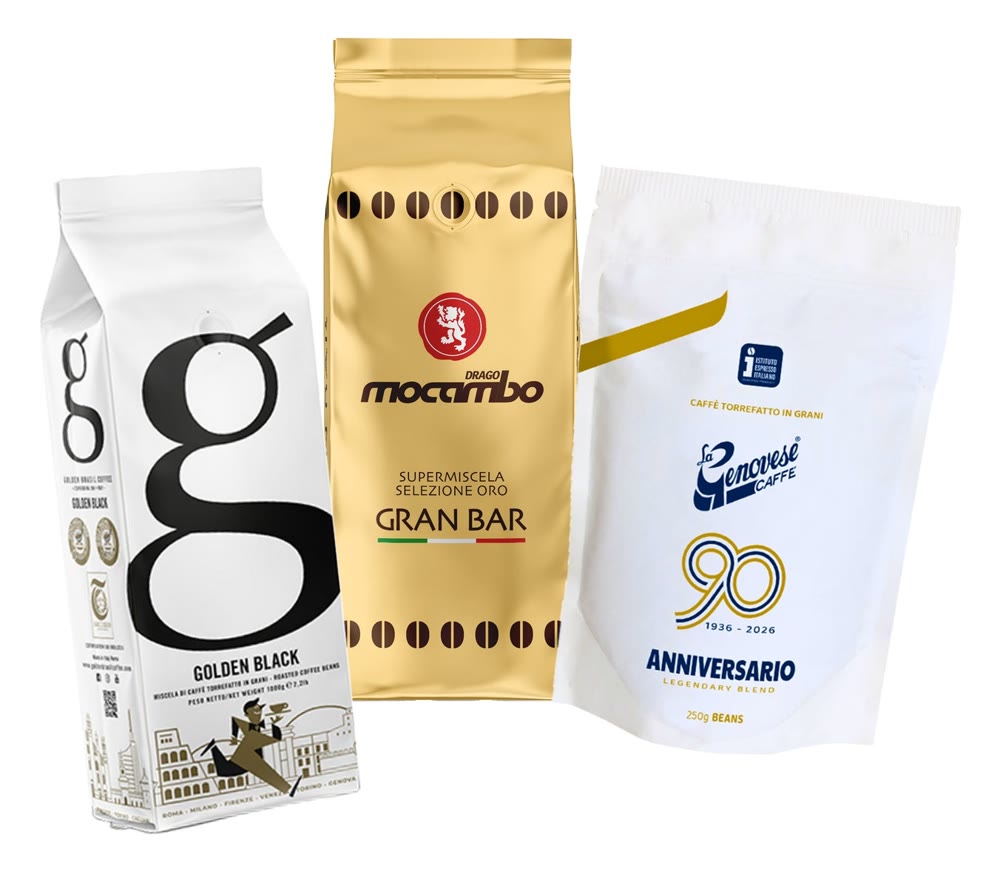
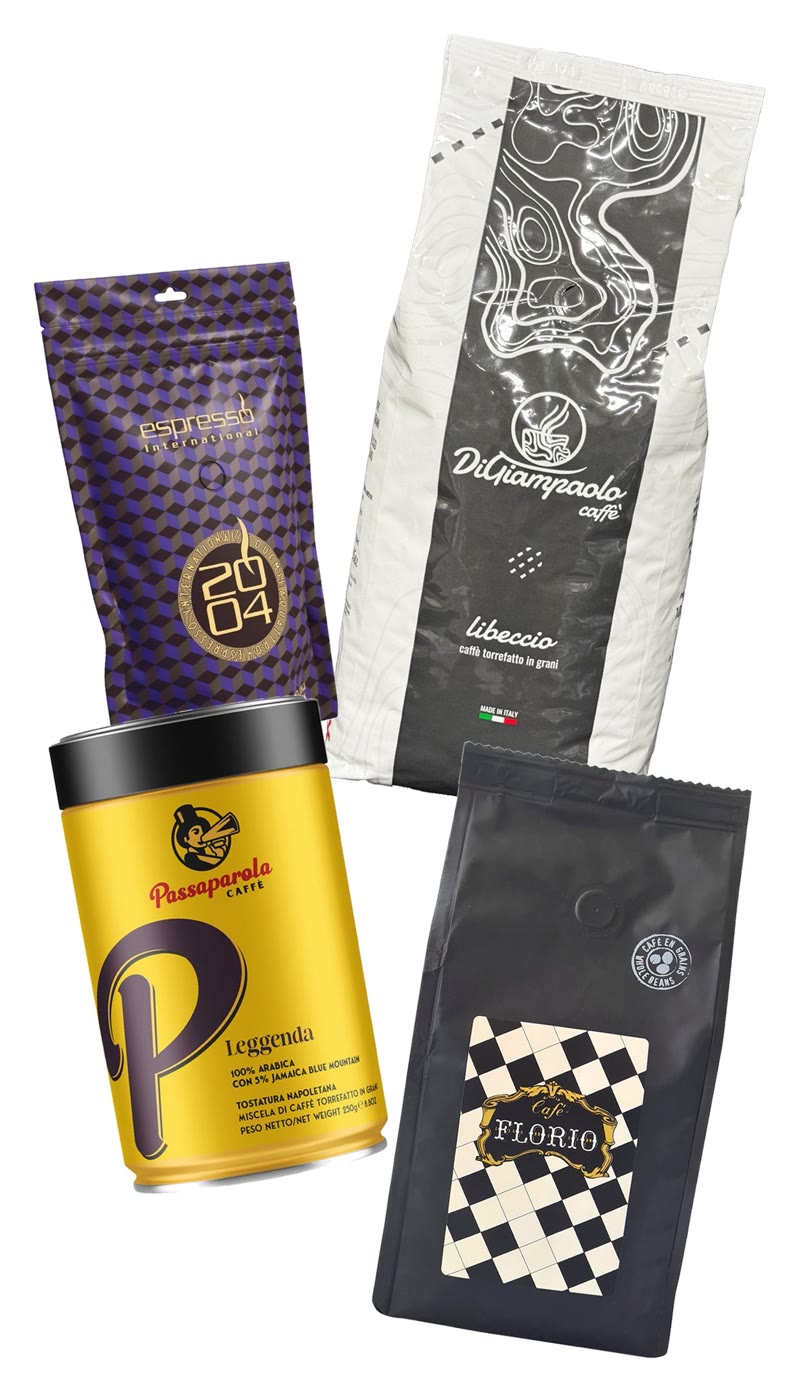
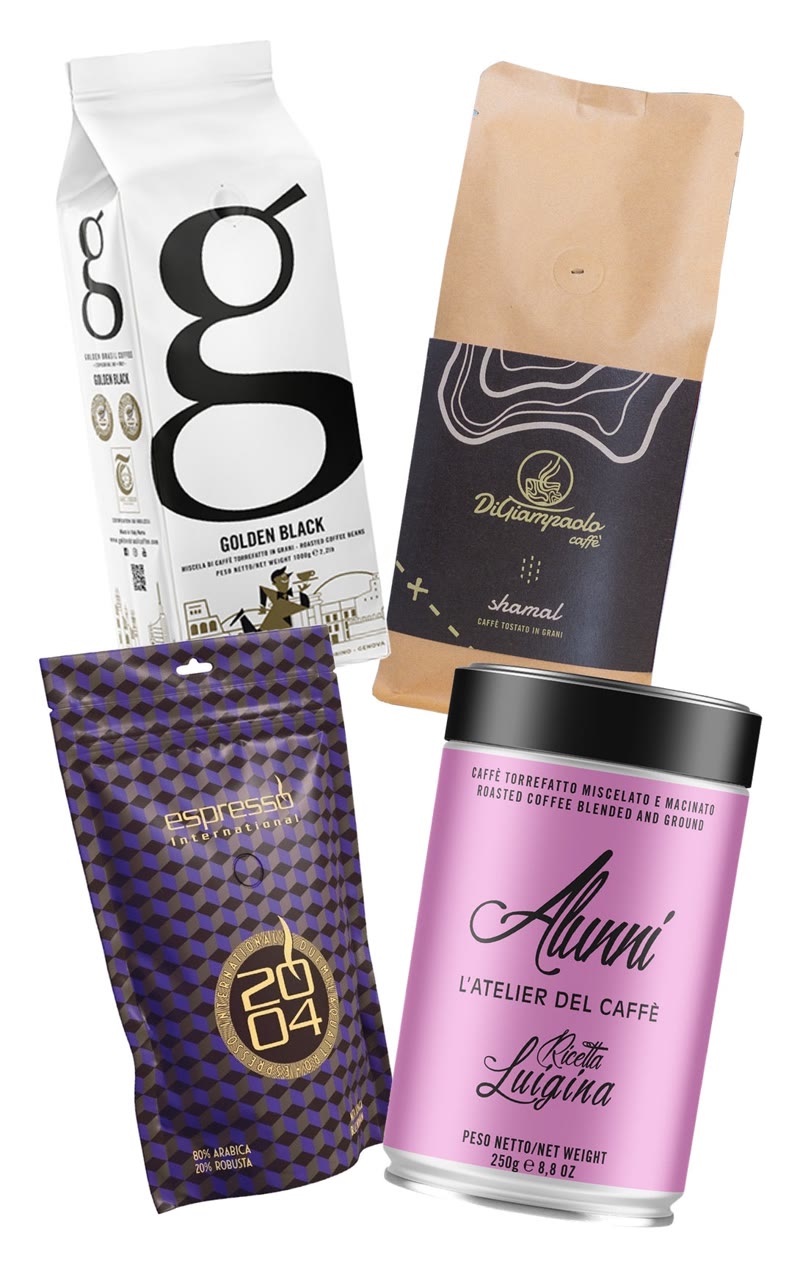
Espresso International sells Italian espresso, from big brands to small roasting companies. Customers are loyal: 44.8% of all customers order a second time within two years.

That’s why Google Ads’ mission is not “more sales”, but: to win new customers who stay. Existing customers are coming anyway.

Challenge

Every new customer was worth the same for Google

A try set and a kilo of the later favorite coffee got the same extrapolation factor. Good and weak entry-level products were indistinguishable.

The customer history was lost

After the shop relaunch, 68.1% of orders carried the import date instead of the real purchase date. Only around 24% of customer histories remained usable.

A grown account without customer logic

An external tool adjusted daily target values and budgets, the structure did not follow any customer value.

The objective Google should recognize which new customers are valuable in the long term, and offer more exactly for them.

First the data. Then the analysis. Then the account.

History reconstructed

Real purchase data retrieved from the original import files of the shop migration and cross-checked in triplicate: natural time distribution, 100% e-mail compliance for all checked orders, no contradictions.

Formed segments

357 entry-level products are divided into four segments according to repurchase and customer value. Winner: lots of value, come back. Grinder: comes back reliably. Whale: big first purchase, less often back. Folder: Get out early.

Newly built account

Segment and performance level per product in the feed. New campaigns by product value from 20.07.2026.

Measured, not estimated

Segment values first as test tracking, ProfitMetrics as second source, re-measurement with real cohorts.

97 %

evaluable customer histories instead of around 24%

62,4 %

Re-purchase rate of Winner entries

35,7 %

Repurchase rate of folder entries

0,62

Relationship between the first and subsequent order value

Repurchase rate by entry-level segment: Winner 62.4%, Grinder 57.4%, Whale 47.3%, Folder 35.7%. Base are all customers with at least 90 days of observation, orders July 2024 to July 2026.

26.2% of customers stay with a single brand. On average, a customer buys 3.2 brands, the price category is the more stable anchor.

Bestsellers are not an entry point One of the three highest-grossing coffees enters as a folder. Sales alone do not make a good entry-level product.

Conclusion

Espresso International did not have a range problem, but a rating problem: For Google, every new customer counted the same amount, regardless of whether he comes back.

Only the reconstruction of the customer histories, analyzable at 97% instead of around 24%, made the customer value measurable. Winner entrants come back 1.7 times as many times as Folder, according to this value the account is built today. The result: +24.0% new customers with 2.6% less advertising budget, each advertising euro brings 55.9% more new customer revenue.

What really impresses me about Globalist is how deep people are into their respective issues. Whether we’re talking about Google Ads, Meta, A/B testing for ads or our shop, I have someone who knows and is really well prepared every time. I have never seen this happen in an agency at this level.

Justin Bahner, stv. Managing Director · Espresso International

Results.

Summer growth came with less budget this time. Google Ads, each 74 days before and after the changeover: previously 07.05. to 19.07.2026, subsequently 20.07. to 01.10.2026, previous year the same calendar days 2025. Source: Google Ads, new customer conversions by conversion date.

  • Costs per new customer

    In the previous year in the same period only −8.1%. The cost per new customer fell 2.7 times as much.

  • New customers

    With 2.6% less advertising costs. In the previous year, an increase in the season of 25.9% cost 15.7% more budget.

  • Ø Shopping cart in the first purchase

    Last year, only +4.7%. The new customers enter with a larger first purchase.

  • +51.6 %

    New customer revenue

    Last year +31.1%. More than the season explains.

  • New customer revenue per advertising euro

    Last year +13.0 %. The value increased 4.3 times as much.

  • Why we attribute this to the changeover

    In the summer, new customers grow every year, in 2025 by 26% over the same period. At that time, it cost 15.7% more budget. In 2026, the same growth came with less budget.

Our services.

  • Data reconstruction: Order history restored after the shop migration
  • Customer analysis: repurchase and customer value per entry-level product, four segments
  • Account architecture: campaigns by product and customer value, brand and generic segregation
  • Feed control: segments as custom labels, shopping via CSS
  • Search terms: cleaned up and sorted by intention
  • Measurement: ProfitMetrics as a second source for new customers
  • Cohort measurement: real buy-back after 90, 180 and 270 days
  • Cross-Channel: the same analysis controls the product choice in Meta
More conversions with dynamic ads.Next Success Story

Write your next success story.

Book a free 30-minute strategy call. We'll look at where you stand and identify your first opportunities for growth.